
The March quarter saw a big increase in inflation. The annualised increase in the Consumer Price Index (CPI) has not been that large since the introduction of the GST in 2001 – caused by bottlenecks as the world economy emerges from the pandemic and exacerbated by the war in Ukraine and the sanctions on Russia.
The main drivers for the quarter were transport, housing and food.
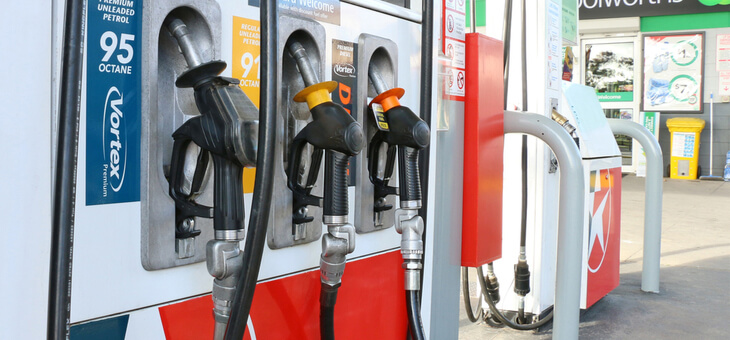
Transport was the biggest driver of inflation with costs increasing by 4.2 per cent for the quarter (and 13.7 per cent for the past 12 months, driven by automotive fuels (i.e. petrol, diesel etc.) that jumped by 11 per cent for the quarter and 35.1 per cent for the year. The price of new cars also rose 1 per cent for the quarter and by 6.6 per cent for the year due continued supply constraints.
Housing increased 2.7 per cent for the quarter and 6.7 per cent for the year. This was driven mainly by new dwellings purchased by owner-occupiers (i.e. the price of building a new house excluding the price of the land),which rose 5.7 per cent for the quarter and 13.7 per cent for the year. Rents rose 0.6 per cent for the quarter – the largest quarterly increase since 2014. Gas and other household fuels also rose, driven by the increase in international gas prices because of the war in Ukraine. They increased 6.3 per cent for the quarter.
Food and non-alcoholic beverages increased 2.8 per cent for the quarter (4.3 per cent for the year). This was mainly driven by vegetables (+6.6 per cent), fruit (+4.9 per cent) and meat and seafood (+4.8 per cent), and caused by rising fertiliser costs and herd rebuilding in response to favourable weather conditions.
The Australian Bureau of Statistics (ABS) splits price movements into essential and non-essential spending. Essential spending includes such things as housing, clothing and groceries and is rising much faster than non-essential spending. While the average for all goods and services rose 5.1 per cent for the past 12 months, spending on essential goods and services rose 6.6 per cent. This affects those on lower incomes more, as they use a larger proportion of their incomes to buy the essentials in life. As a result, the retirement cohorts on lower incomes were most affected by price increases.
Cash-strapped singles experienced the biggest increase (+2.4 per cent), followed by cash-strapped couples (+2.3 per cent). Constrained couples and singles both saw an increase of 2.2 per cent. Well-off couples and singles saw an increase of 2 per cent.
Matt Grudnoff is a senior economist at The Australia Institute.
March 2022 – adjusted Retirement Affordability Table
| Well-off couples | Constrained couples | Cash-strapped couples | Well-off singles | Constrained singles | Cash-strapped singles | |
| Expenditure items | Couple homeowners with private income | Couple homeowners on Age Pension | Couples who rent on Age Pension | Single homeowners with private income | Single homeowners on Age Pension | Single who rent on Age Pension |
| Housing | $198.25 | $117.17 | $221.91 | $133.21 | $98.31 | $174.83 |
| As a percentage of expenditure | 13% (+1%) | 13% | 29% | 15% | 20% (+1%) | 36% |
| Domestic fuel & power | $43.52 | $32.68 | $34.5 | $31.47 | $28.17 | $23.91 |
| As a percentage of expenditure | 3% | 4% | 5% | 4% | 6% | 5% |
| Food & non-alcoholic beverages | $260.30 | $183.34 | $165.78 | $130.77 | $91.92 | $82.38 |
| As a percentage of expenditure | 17% (+1%) | 20% | 22% | 15% | 18% | 17% |
| Alcoholic beverages & tobacco products | $57.96 | $31.66 | $51.46 | $31.27 | $18.61 | $26.16 |
| As a percentage of expenditure | 4% | 3% (-1%) | 7% | 3% (-1%) | 4% | 5% (-1%) |
| Clothing and footwear | $30.36 | $17.23 | $9.11 | $20.19 | $8.76 | $7.22 |
| As a percentage of expenditure | 2% | 2% | 1% | 2% | 2% | 2% |
| Household furnishings & equipment | $78.46 | $34.04 | $20.71 | $42.93 | $19.93 | $15.90 |
| As a percentage of expenditure | 5% | 4% | 3% | 5% | 4% | 3% |
| Household services & operation | $46.94 | $33.21 | $17.94 | $42.35 | $23.93 | $12.72 |
| As a percentage of expenditure | 3% | 4% | 2% | 5% | 5% | 3% |
| Medical & health care | $159.25 | $113.51 | $39.30 | $91.44 | $40.49 | $23.96 |
| As a percentage of expenditure | 10% | 13% | 5% | 10% | 8% | 5% |
| Transport | $222.12 | $144.19 | $68.56 | $117.66 | $60.01 | $40.47 |
| As a percentage of expenditure | 14% | 16% | 9% | 13% | 12% | 8% |
| Communication | $34.07 | $24.15 | $26.13 | $32.98 | $17.02 | $13.28 |
| As a percentage of expenditure | 2% | 3% | 3% | 4% | 3% | 3% |
| Recreation | $310.17 | $105.33 | $68.49 | $144.46 | $54.34 | $32.80 |
| As a percentage of expenditure | 20% | 12% | 9% | 16% | 11% | 7% |
| Education | $0.64 | $0.23 | $0 | $0.14 | $0.13 | $0.01 |
| As a percentage of expenditure | 0% | 0% | 0% | 0% | 0% | 0% |
| Personal care | $30.77 | $18.67 | $12.98 | $19.17 | $10.11 | $8.96 |
| As a percentage of expenditure | 2% | 2% | 2% | 2% | 2% | 2% |
| Miscellaneous goods & services | $93.24 | $50.28 | $25.15 | $56.60 | $27.54 | $17.16 |
| As a percentage of expenditure | 6% | 6% | 3% | 6% | 6% | 4% |
| Total weekly expenditure | $1,566.05 | $905.7 | $762.02 | $894.65 | $499.3 | $479.76 |
| +$30.49 | +$19.64 | +$17.30 | +$17.64 | +$10.67 | +$11.2 | |
| Total monthly expenditure | $6,786.24 | $3,924.70 | $3,302.07 | $3,876.83 | $2,163.62 | $2,078.98 |
| +$132.13 | +$85.10 | +$74.93 | +$76.47 | +$46.23 | +$48.57 | |
| Total annual expenditure | $81,434.86 | $47,096.36 | $39,624.84 | $46,521.93 | $25,963.45 | $24,947.78 |
| +$1,585.52 | +$1,021.22 | +$899.20 | +$917.60 | +$554.71 | +$582.86 |
If you enjoy our content, don’t keep it to yourself. Share our free eNews with your friends and encourage them to sign up.