

The Australian government spends billions on boosting retirement incomes. The two biggest costs, the Age Pension and superannuation tax concessions, are expected to total $95 billion this year. That’s more than it will spend on health.
For that kind of money, you might expect that retired people in Australia are doing very well. But a quick look at the 36 OECD (Organisation for Economic Cooperation and Development) nations shows that Australia has the fourth highest rates of poverty in retirement.
Australia’s retirement income system is flawed.
This is because much of the help boosting retirement incomes goes to those who do not need government support and not enough goes to those who really need it. While spending on the Age Pension ($54 billion) is well targeted, more than half of super tax concessions ($41 billion) goes to those who do not need income support in retirement.
To highlight the shortcomings of the system and the difficulties faced by key retiree cohorts, YourLifeChoices and The Australia Institute teamed up in 2017 to take a closer look at how different groups of retirees were coping financially in retirement. There was a serious lack of information regarding this issue, which has contributed to it being overlooked in the public policy arena. The aim was four years ago as it is now – to provide more accurate information to shape policy, planning and expectations. Our figures show the true cost of retirement.
Rather than look at all retired people as one homogenous group, we break them into six cohorts to gain a more nuanced view of how each is coping financially. This allows us to look at the inequality that is inherent in the retirement income system. The study, released as the Retirement Affordability Index and updated each quarter, allows a more detailed examination of how different cohorts are spending their money and how the cost of living affects each group.
This work has uncovered the fault lines in retirement incomes and has shown who is doing well and who is struggling. An important fault line is housing, with those who don’t own their home in retirement facing much greater cost of living pressures. This has important policy implications for government. But before we go any further, let’s look at our six cohorts.
We split retired people (i.e. those aged 54 and over living in households where no one is in the workforce) in three ways.
First, we split them into two groups by their main source of income.
The first group is those retirees who derive most of their income from government pensions and allowances, including the Age Pension.
The second group derives most income from private investments, including superannuation. If a couple has some superannuation earnings but gets more from the Age Pension, then they would be categorised as getting their main source of income from pensions and allowances. Similarly, those who get most of their income from investments but still draw a part pension are classified as getting their main source of income from private sources.
Then, we split the groups into couple and single households.
Finally, we split the groups by their housing tenure – those who own their home (either outright or with a mortgage) and those who rent, either privately or publicly.
This would give us eight groups of retirees. However, we removed two groups because they represent such a small portion of the population and we cannot obtain reliable data for them. The two groups excluded are couples and singles who rent and get most of their income from private sources.
Those who have significant investments, including superannuation, almost always own their home. Given that the main residence is exempt from the Age Pension assets test, this is a further encouragement for retirees with significant wealth to invest in their own home. The result is that there are very few retirees with significant investment assets who choose to rent. This is not to say that there are no retirees in this category, only that the numbers are so small that we can’t obtain reliable figures on them.
This leaves us with six cohorts. They are:
- couples who earn most of their income from the Age Pension and own their home (constrained couples)
- singles who earn most of their income from the Age Pension and own their home (constrained singles)
- couples who earn most of the income from the Age Pension and rent (cash-strapped couples)
- singles who earn most of their income from the Age Pension and rent (cash-strapped singles)
- couples who earn most of their income from private investments and own their home (well-off couples)
- singles who earn most of their income from private investments and own their home (well-off singles)
We use data from the Australian Bureau of Statistics (ABS) Household Expenditure Survey, which shows how Australians spend their money. It places spending into 12 broad expenditure categories. From this, we can see how much the average household in each of the six cohorts spends in each category.
This gives us valuable insights into the problems of poverty in retirement. For example, those who rent spend substantially more of their income on housing. Most retirees who own their home do so outright and spending on housing is mainly on maintenance and various government taxes such as rates.
This means that those who rent in retirement face much tougher spending decisions. Retired renters spend, on average, 34 per cent of their income on housing, while those who own their home spend only about 14 per cent.
Spending almost two and half times as much on housing means that retired renters need to cut back in other areas, with recreation and transport most affected. The average retired homeowner spends about 30 per cent on recreation and transport, while the average retired renter spends only 16 per cent.
As a result, retired renters have fewer opportunities to get out and interact with other people. Retirement for some people can be a lonely and isolating time and being a renter in retirement increases that likelihood because of reduced financial circumstances.
The other area in which retired renters cut back is healthcare. While the average retired homeowner spends 10 per cent on healthcare, the average retired renter spends five per cent on healthcare. It is very concerning if retired renters are unable to afford medication or are putting off seeing health professionals.
While renters incur significantly higher housing costs, they also face higher cost of living increases. In the figure below, we compare price increases for our six different cohorts since 2001.
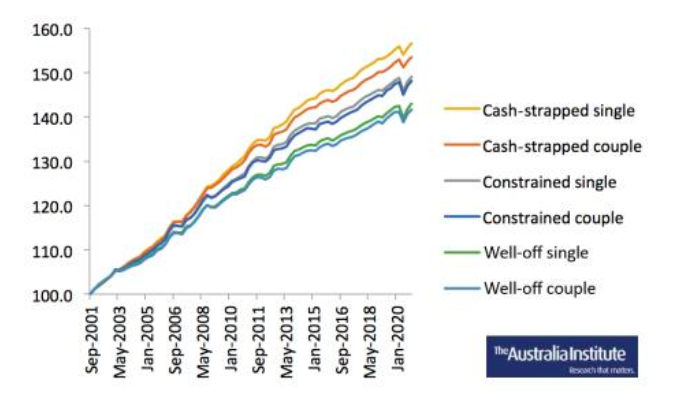
The two renting cohorts (cash-strapped couples and singles) faced the highest price increases. Homeowners who derive most of their income from private sources (well-off couples and singles) faced the lowest cost of living increases. Pensioners who own their home (constrained couples and singles) are between those two groups.
Over time, retired renters will see their purchasing power (the amount of goods and services they can buy) shrink compared with retired homeowners. With housing affordability getting worse over time, the inequality among retirees can be expected to increase rather than diminish.
The Retirement Affordability Index is a valuable resource not only for retirees and pre-retirees seeking accurate information on the true cost of retirement, but also for government and welfare agencies ‘interested’ in addressing the most critical concerns of older Australians.
See the latest annual cost estimates for the six cohorts here.
Have you found it challenging to get accurate estimates of retirement costs for your personal situation?
If you enjoy our content, don’t keep it to yourself. Share our free eNews with your friends and encourage them to sign up.
Related articles:
https://www.yourlifechoices.com.au/finance/age-pension-payments-in-2021-what-you-need-to-know
https://www.yourlifechoices.com.au/age-pension/retirement-system-uncertain-for-almost-all-retirees
https://www.yourlifechoices.com.au/age-pension/pension-rates-pbs-entitlements-health-fund-changes
Disclaimer: All content in the Retirement Affordability Index™ is of a general nature and has been prepared without taking into account your objectives, financial situation or needs. It has been prepared with due care but no guarantees are provided for the ongoing accuracy or relevance. Before making a decision based on this information, you should consider its appropriateness in regard to your own circumstances. You should seek professional advice from a financial planner, lawyer or tax agent in relation to any aspects that affect your financial and legal circumstances.